Presentation
What are mSupply dashboards ?🔗
The mSupply dashboard retrieves data from the software and presents it in a series of visual indicators and reports to facilitate decision-making. Any data synchronised with the central server can be exported and either visualised directly on the dashboards or used to calculate Key Performance Indicators (KPIs) displayed on them. They are updated in real time as the central server is synchronized, ensuring users always have access to the most current data.
What are dashboards used for ? 🔗
mSupply dashboards are designed for decision-makers at all levels who need tailored reports, historical data, gaps analyses, and high level decision making tools - all without the need to install or use mSupply software.
Here are some sample dashboards with example data. Feel free to explore them :
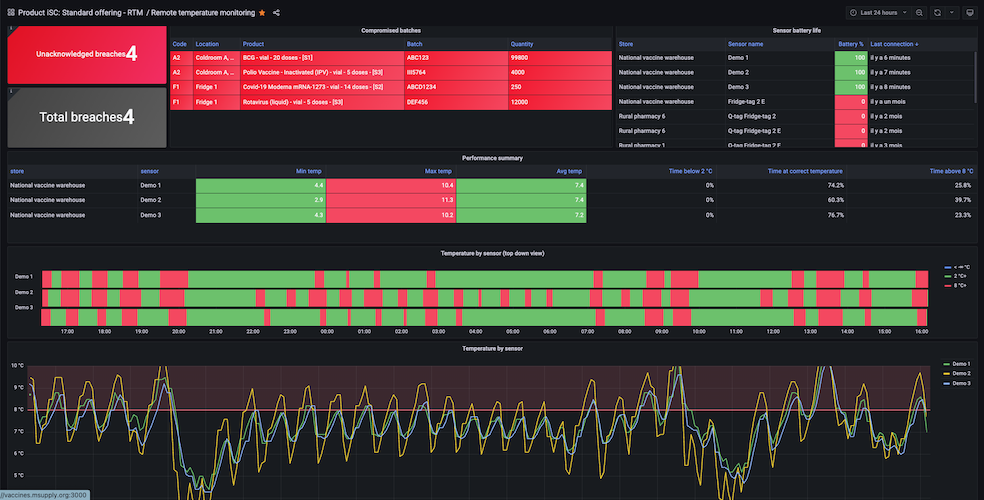
Facility level nurses🔗
They can use the remote temperature monitoring dashboard to monitor temperature logs by facility and sensors, prevent breaches and protect temperature sensitive medicine.
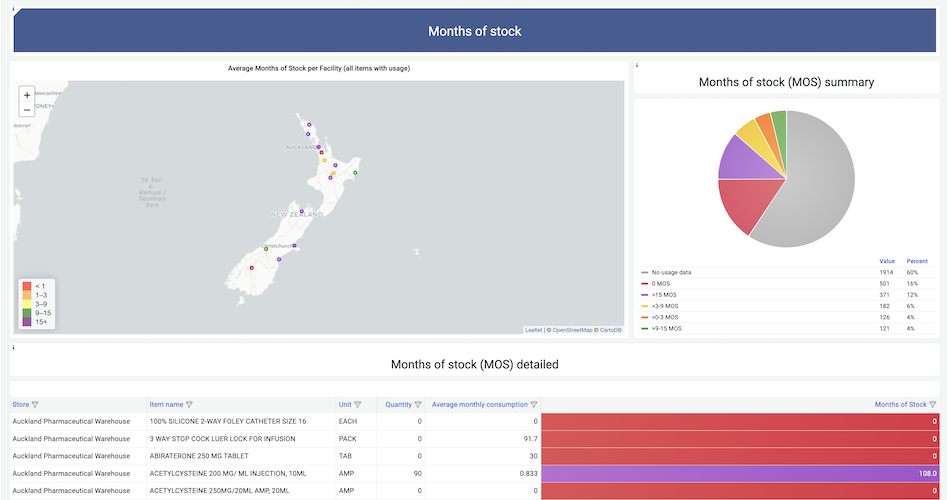
Regional warehouse managers🔗
They can use the stock availability dashboard and the expiring stock dashboard to monitor critical items availability and reduce wastage, the list of orders placed dashboard to manage orders and shipments to lower level facilities.
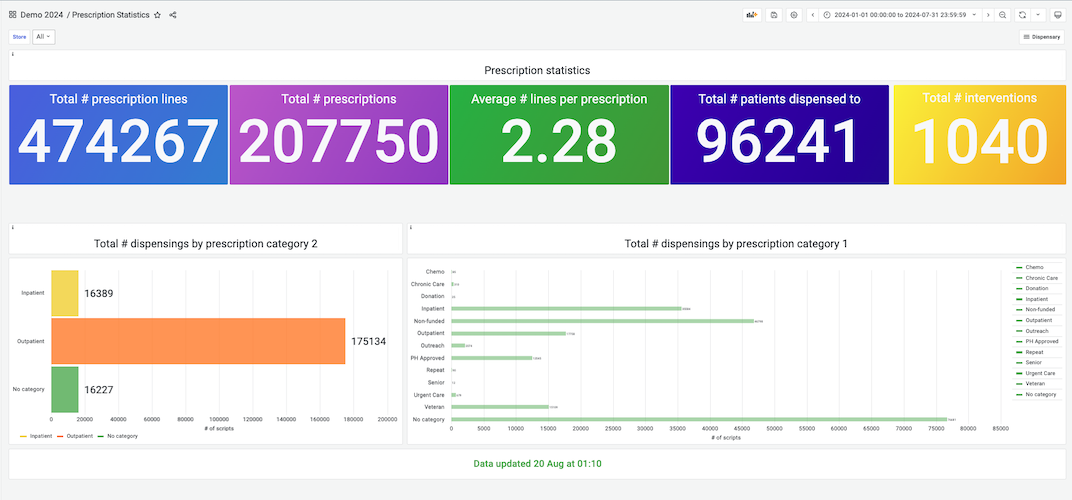
National level decision-makers🔗
For example, to support monitoring the progress of a vaccination campaign, the mSupply dashboard can display a color-coded map showing the percentage of vaccination targets achieved in each region. Another example of clinical data visualisation is the prescriptions statistics dashboard, which presents data per facility.
How are dashboards set up ?🔗
mSupply dashboards are hosted on the web-based open source platform Grafana, which means they can be accessed from any device with a working internet connection. They are specific to a project (i.e a datafile) and can only be accessed with a registered username and password. They are highly customisable including the level of information each user has access to.